portfolio.
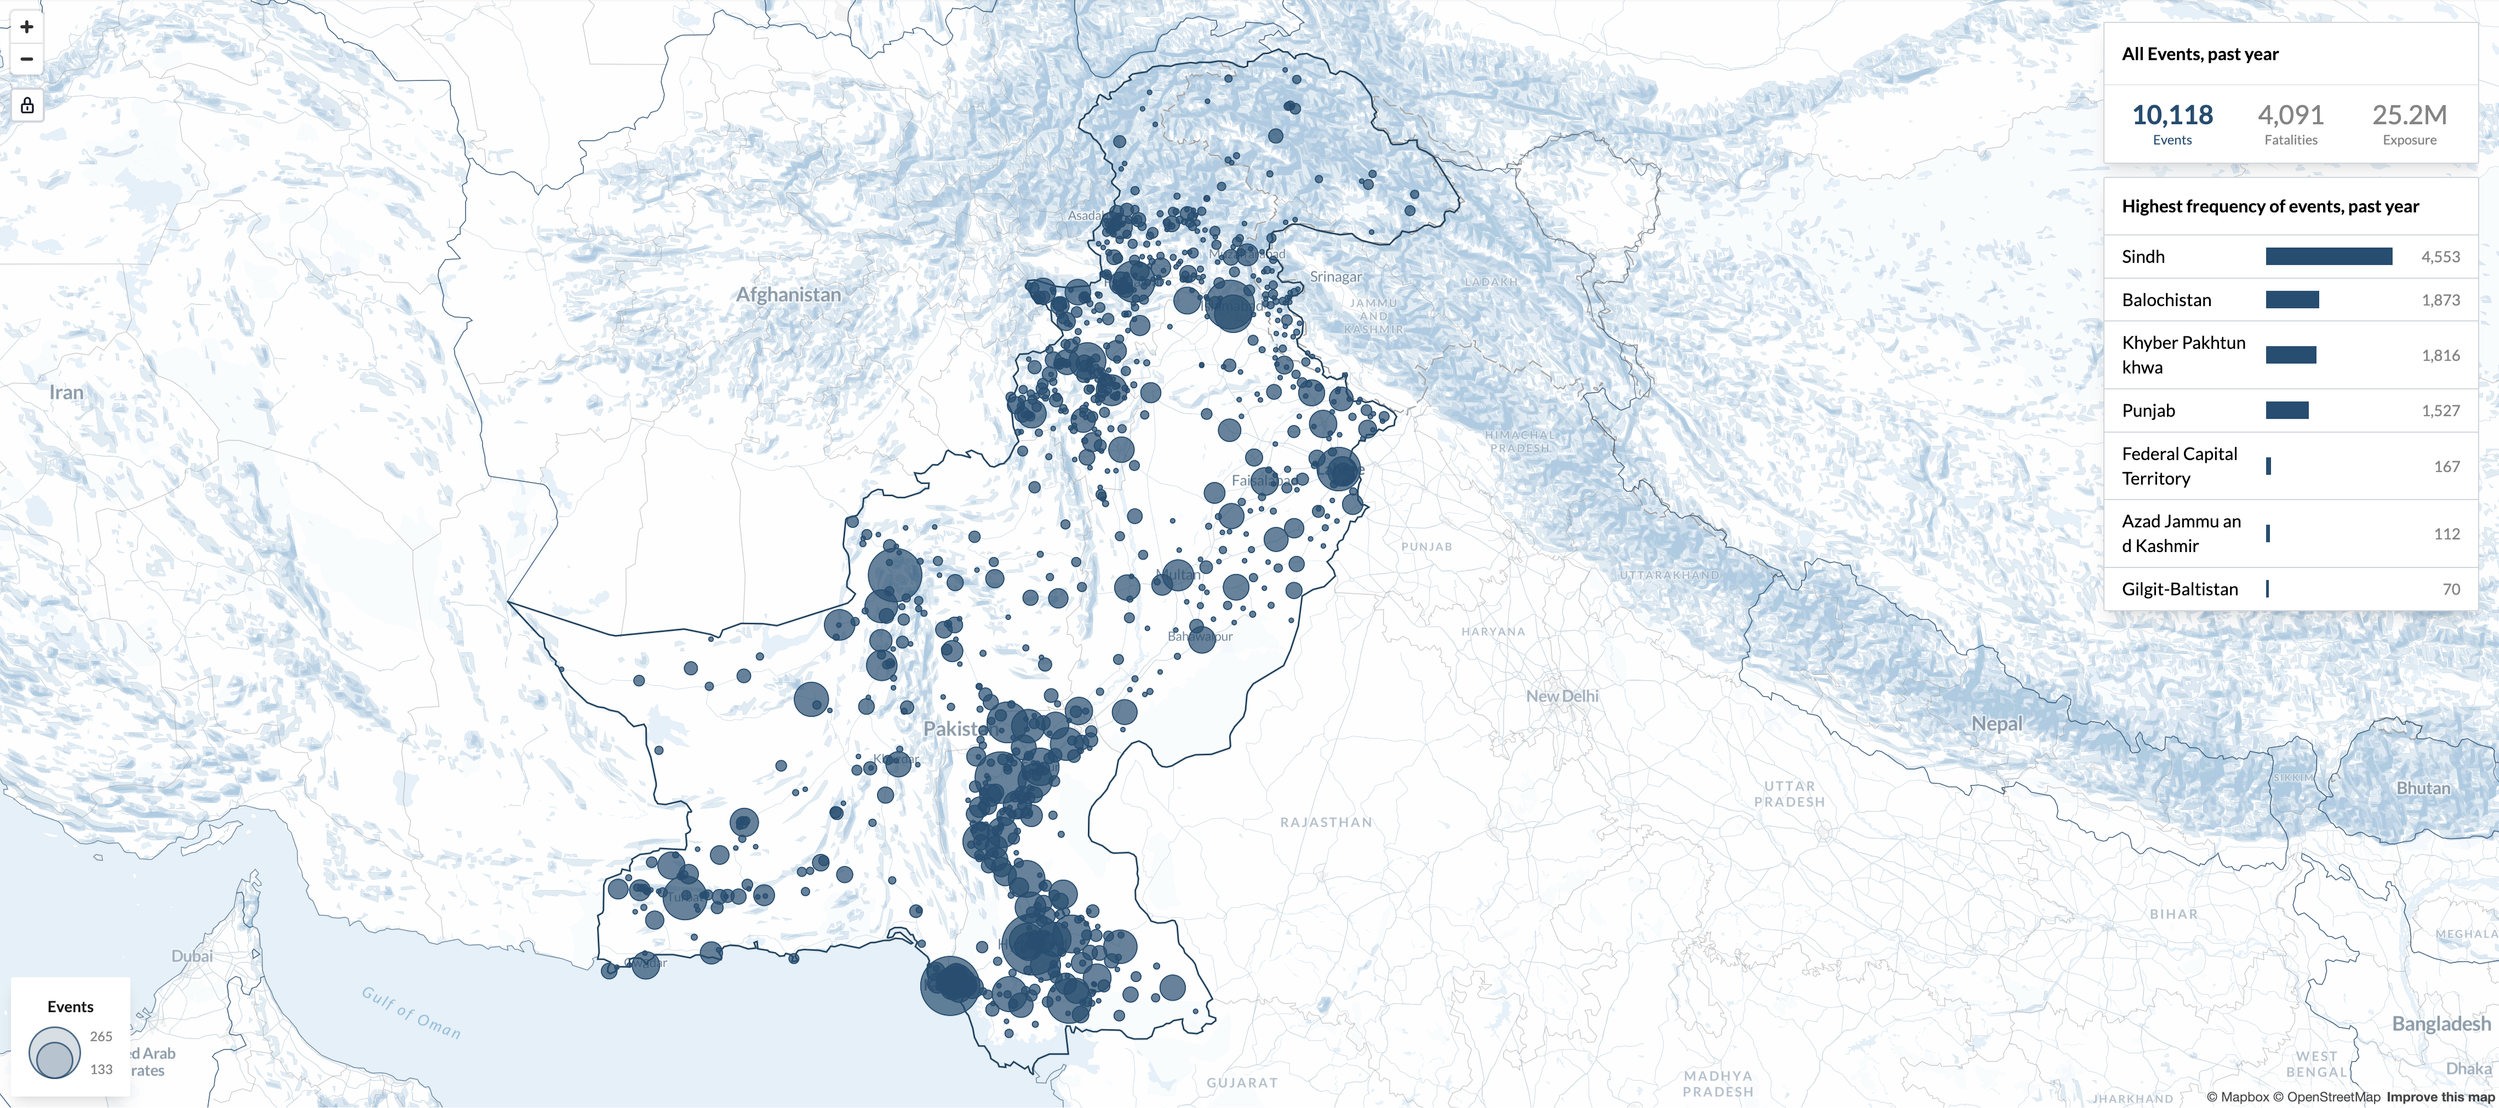
ACLED
conflict explorer.
Visualising conflicts around the world by showing event frequency, fatalities and population exposure in one combined exploratory data display.
Art Direction, Visualisation- UX & UI Design, Development

STRATEGIC PERSPECTIVES
gas insight.
Visualising different scenarios to transition from fossil fuels to cleaner, renewable energy sources
Creative Direction, Visualisation UX & UI Design, Development

WORLD BANK
sdg atlas 2023.
Visualising progress toward the Sustainable Development Goals of the United Nations
Art Direction, Visualisation- UX & UI Design, Development
more client projects.
-
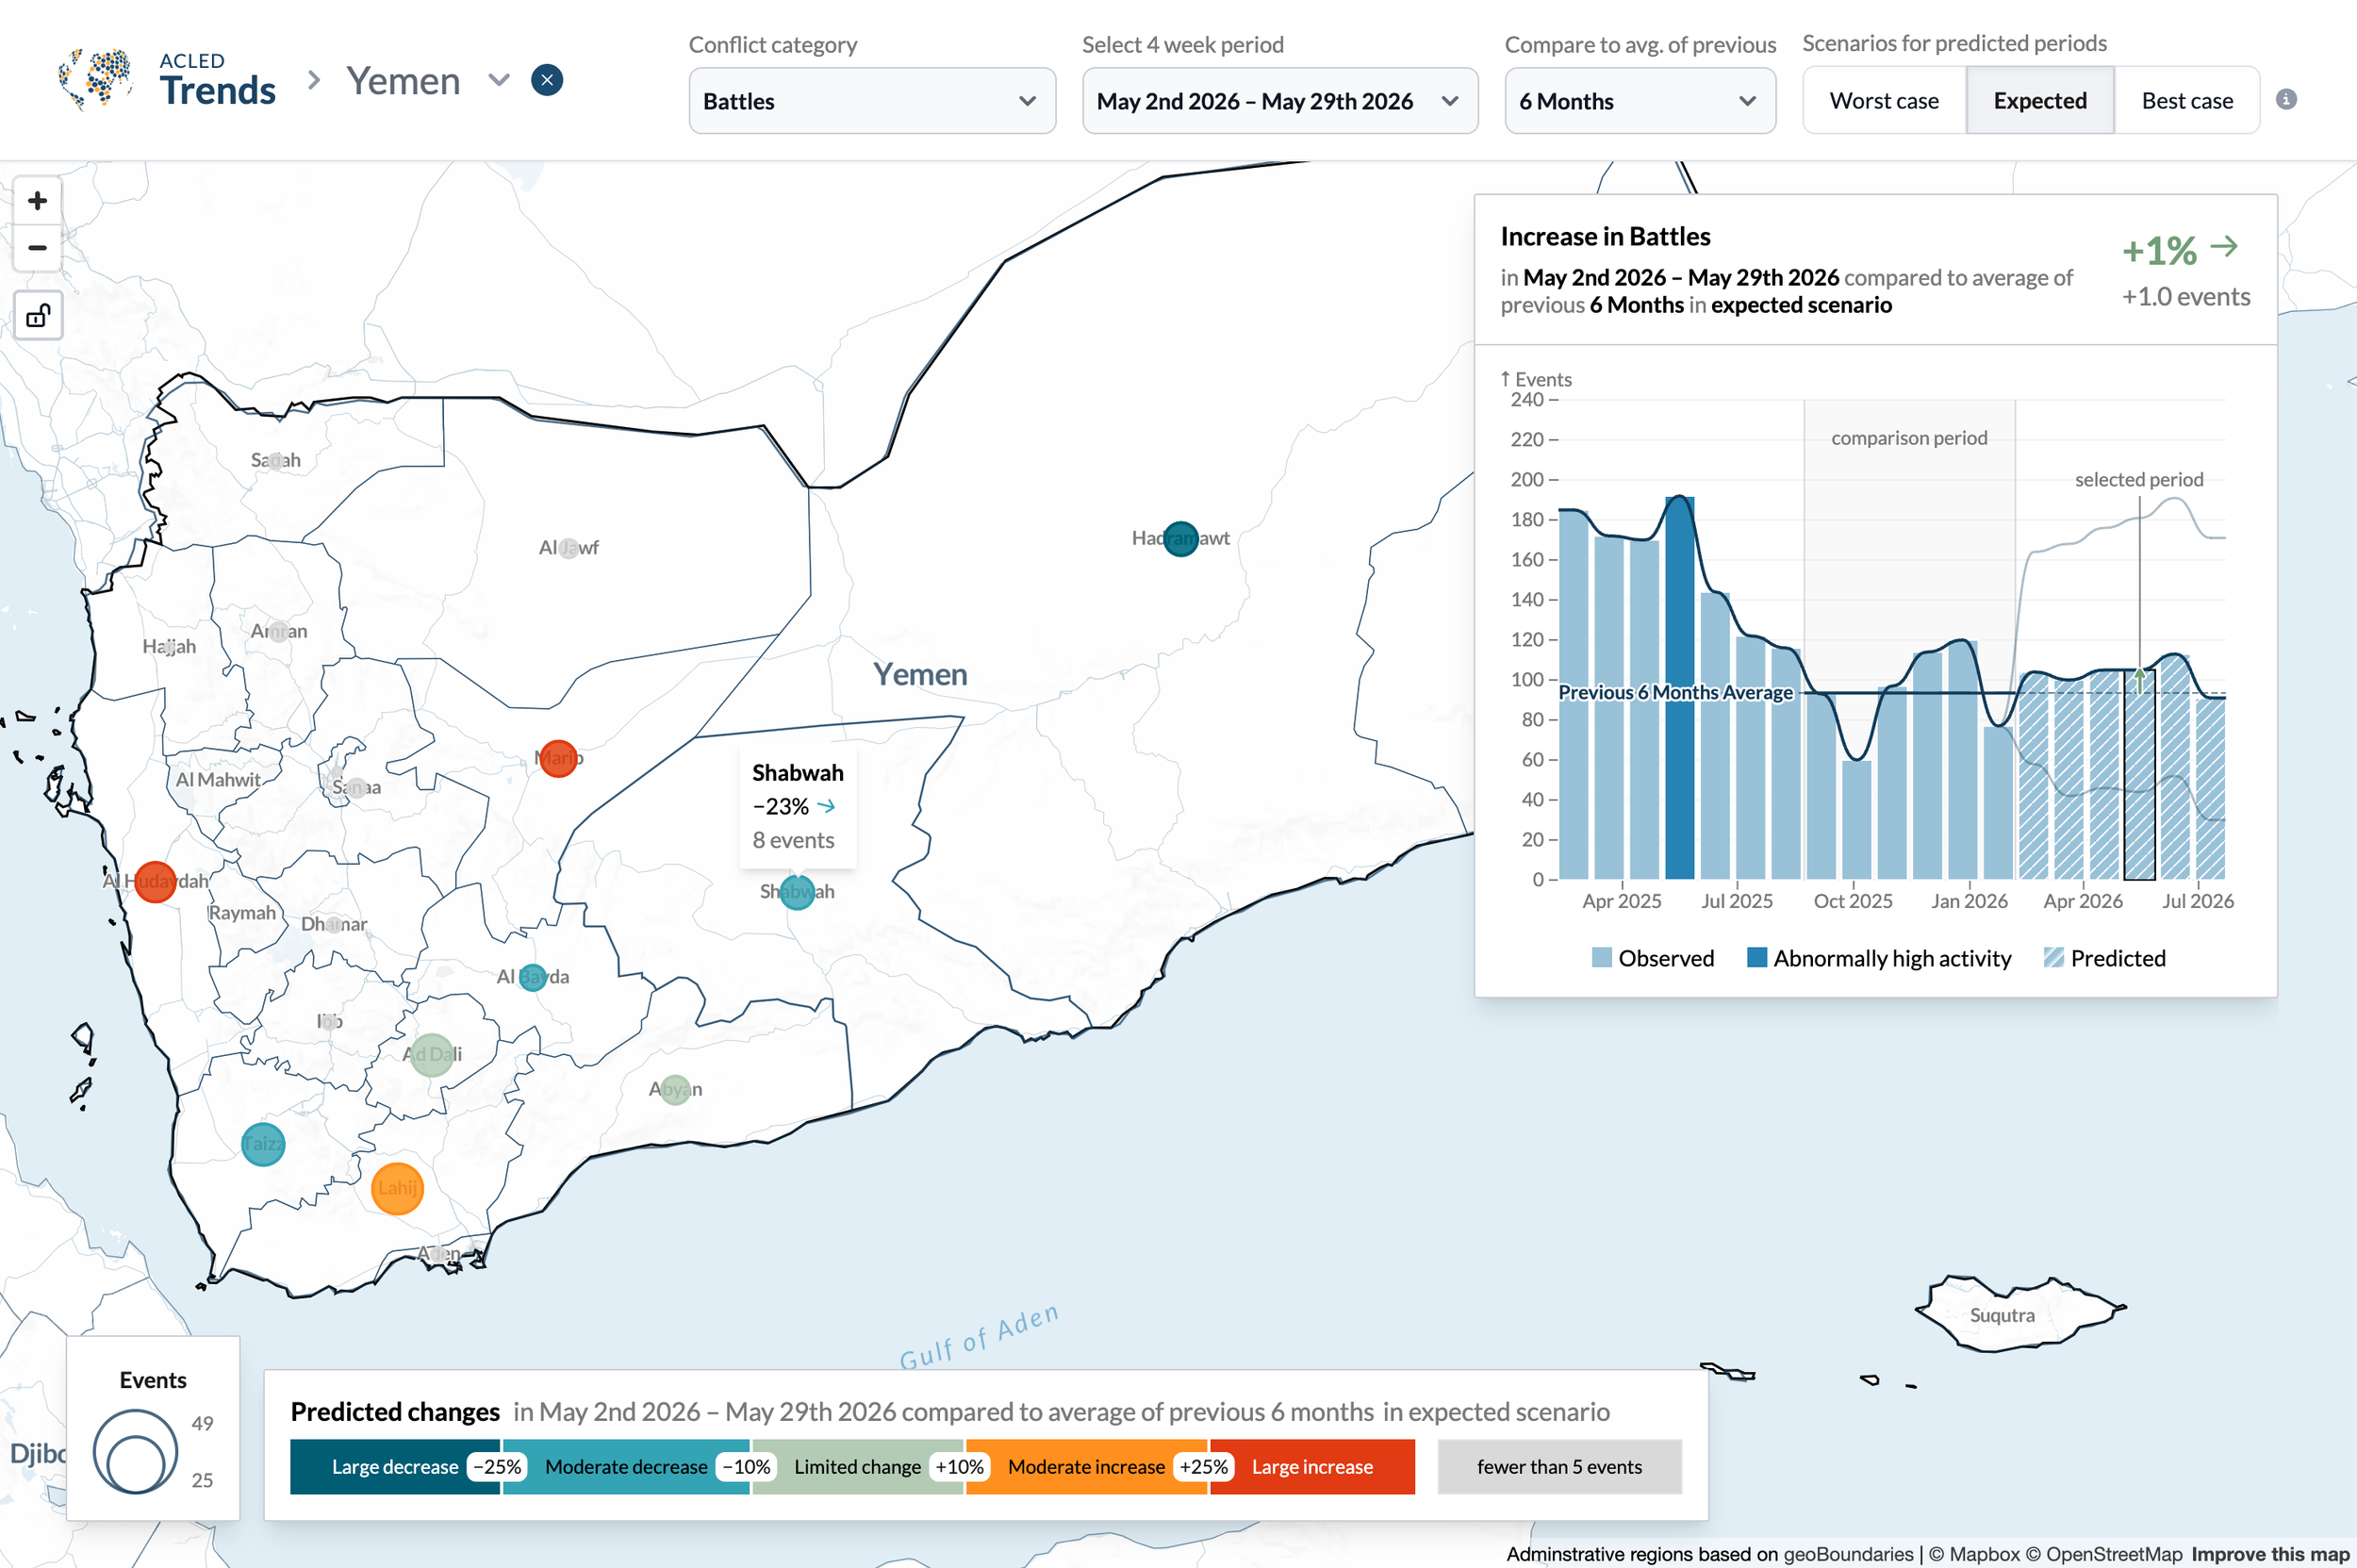
acled trends.
Art Direction & Data Visualisations for a tool that visualises where violence and unrest are most likely to increase. The tool was created for ACLED to help decision-makers see rising or falling risks across locations and future scenarios.
-
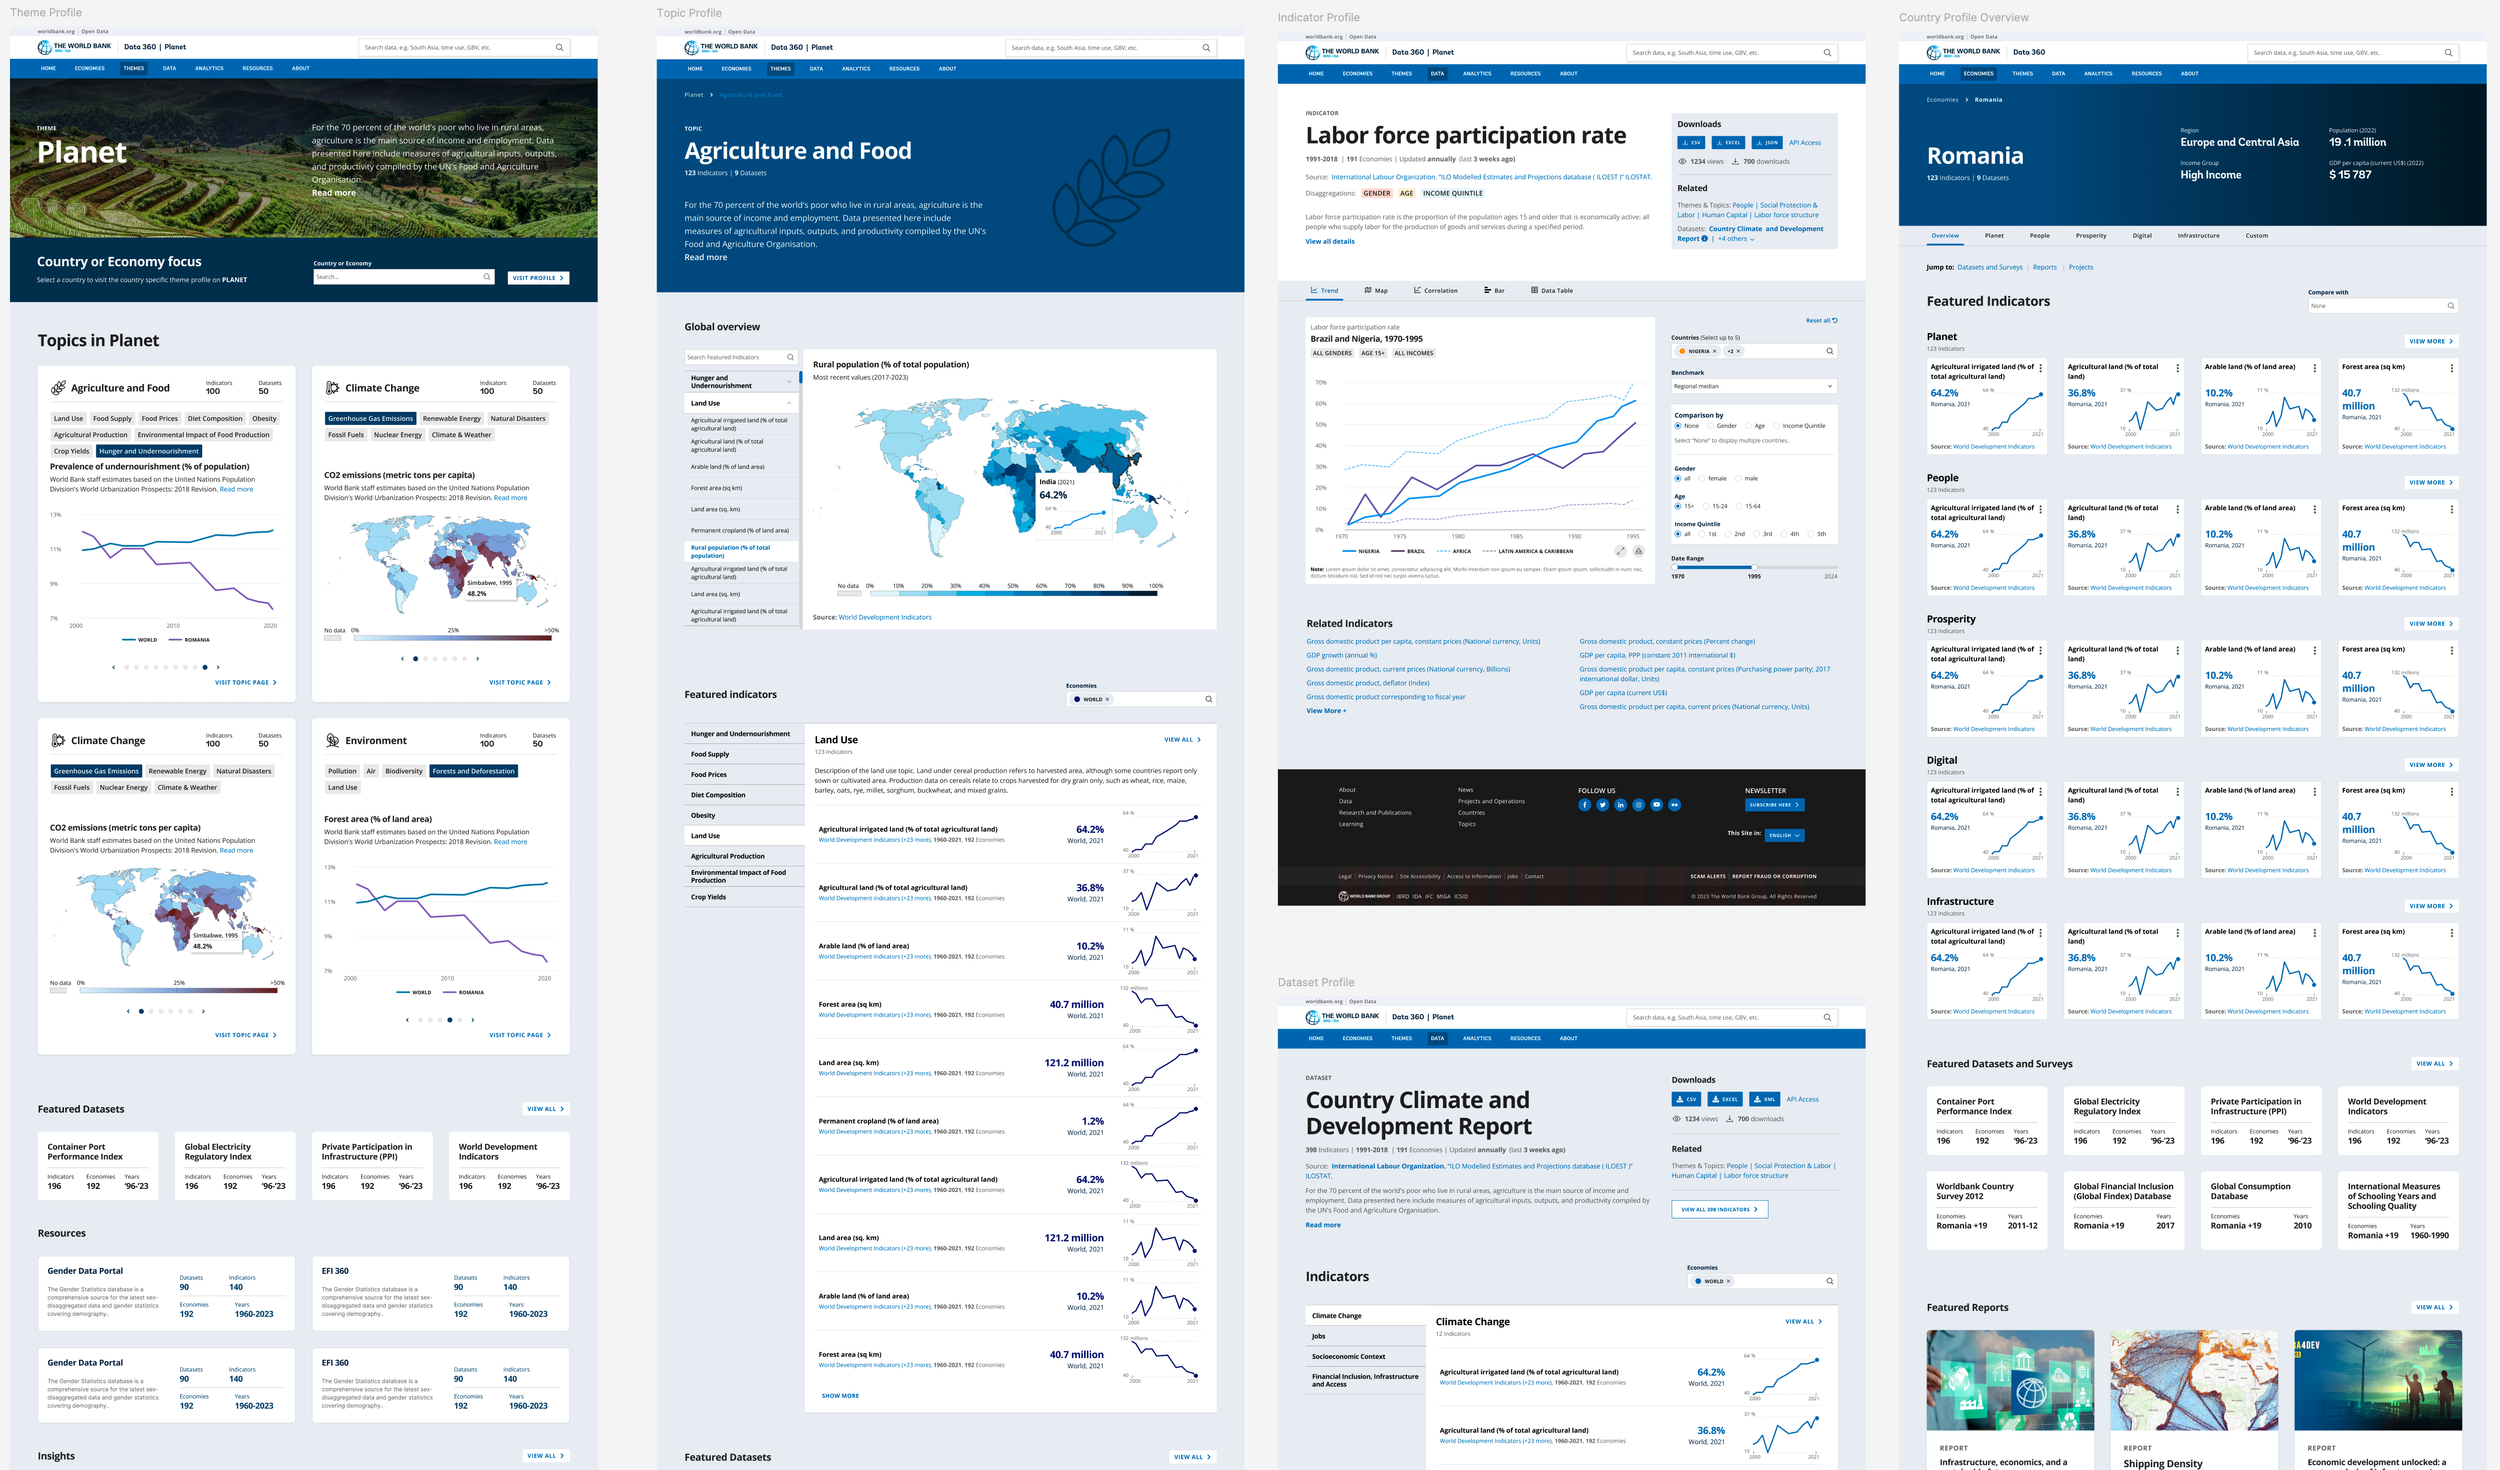
world bank data360.
Concepts, Mockups and UX design for the World Bank’s Open Data Portal Data360.
-
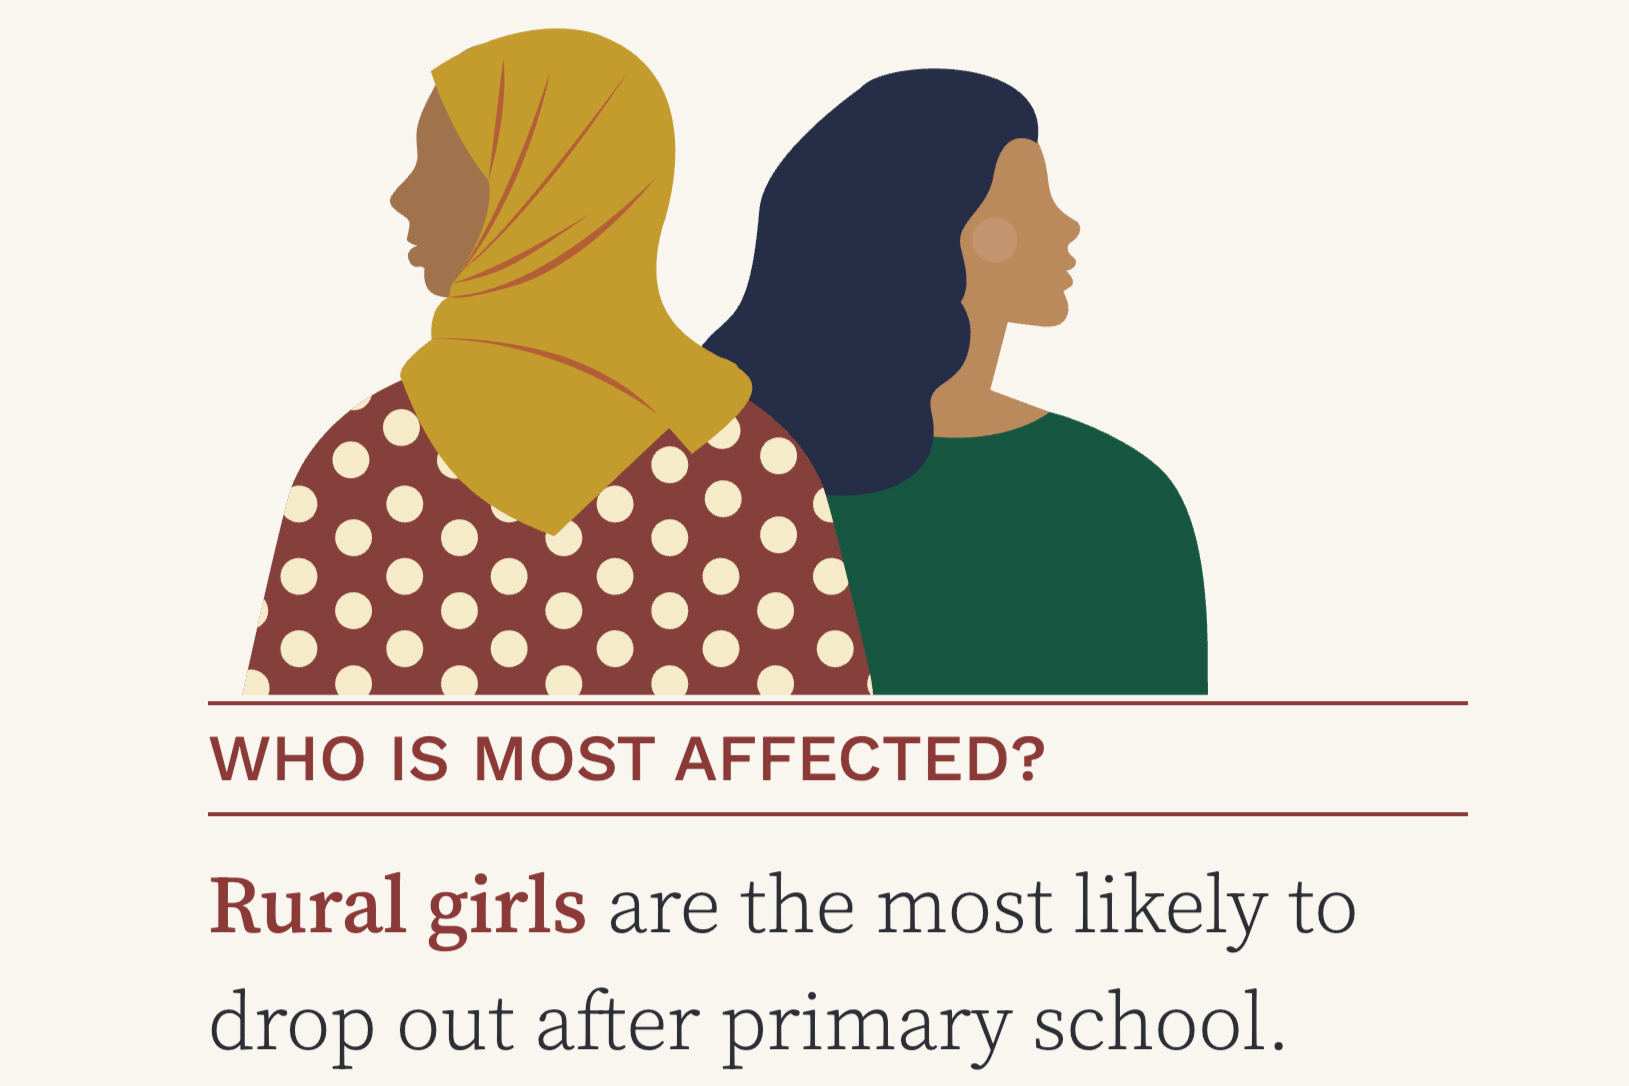
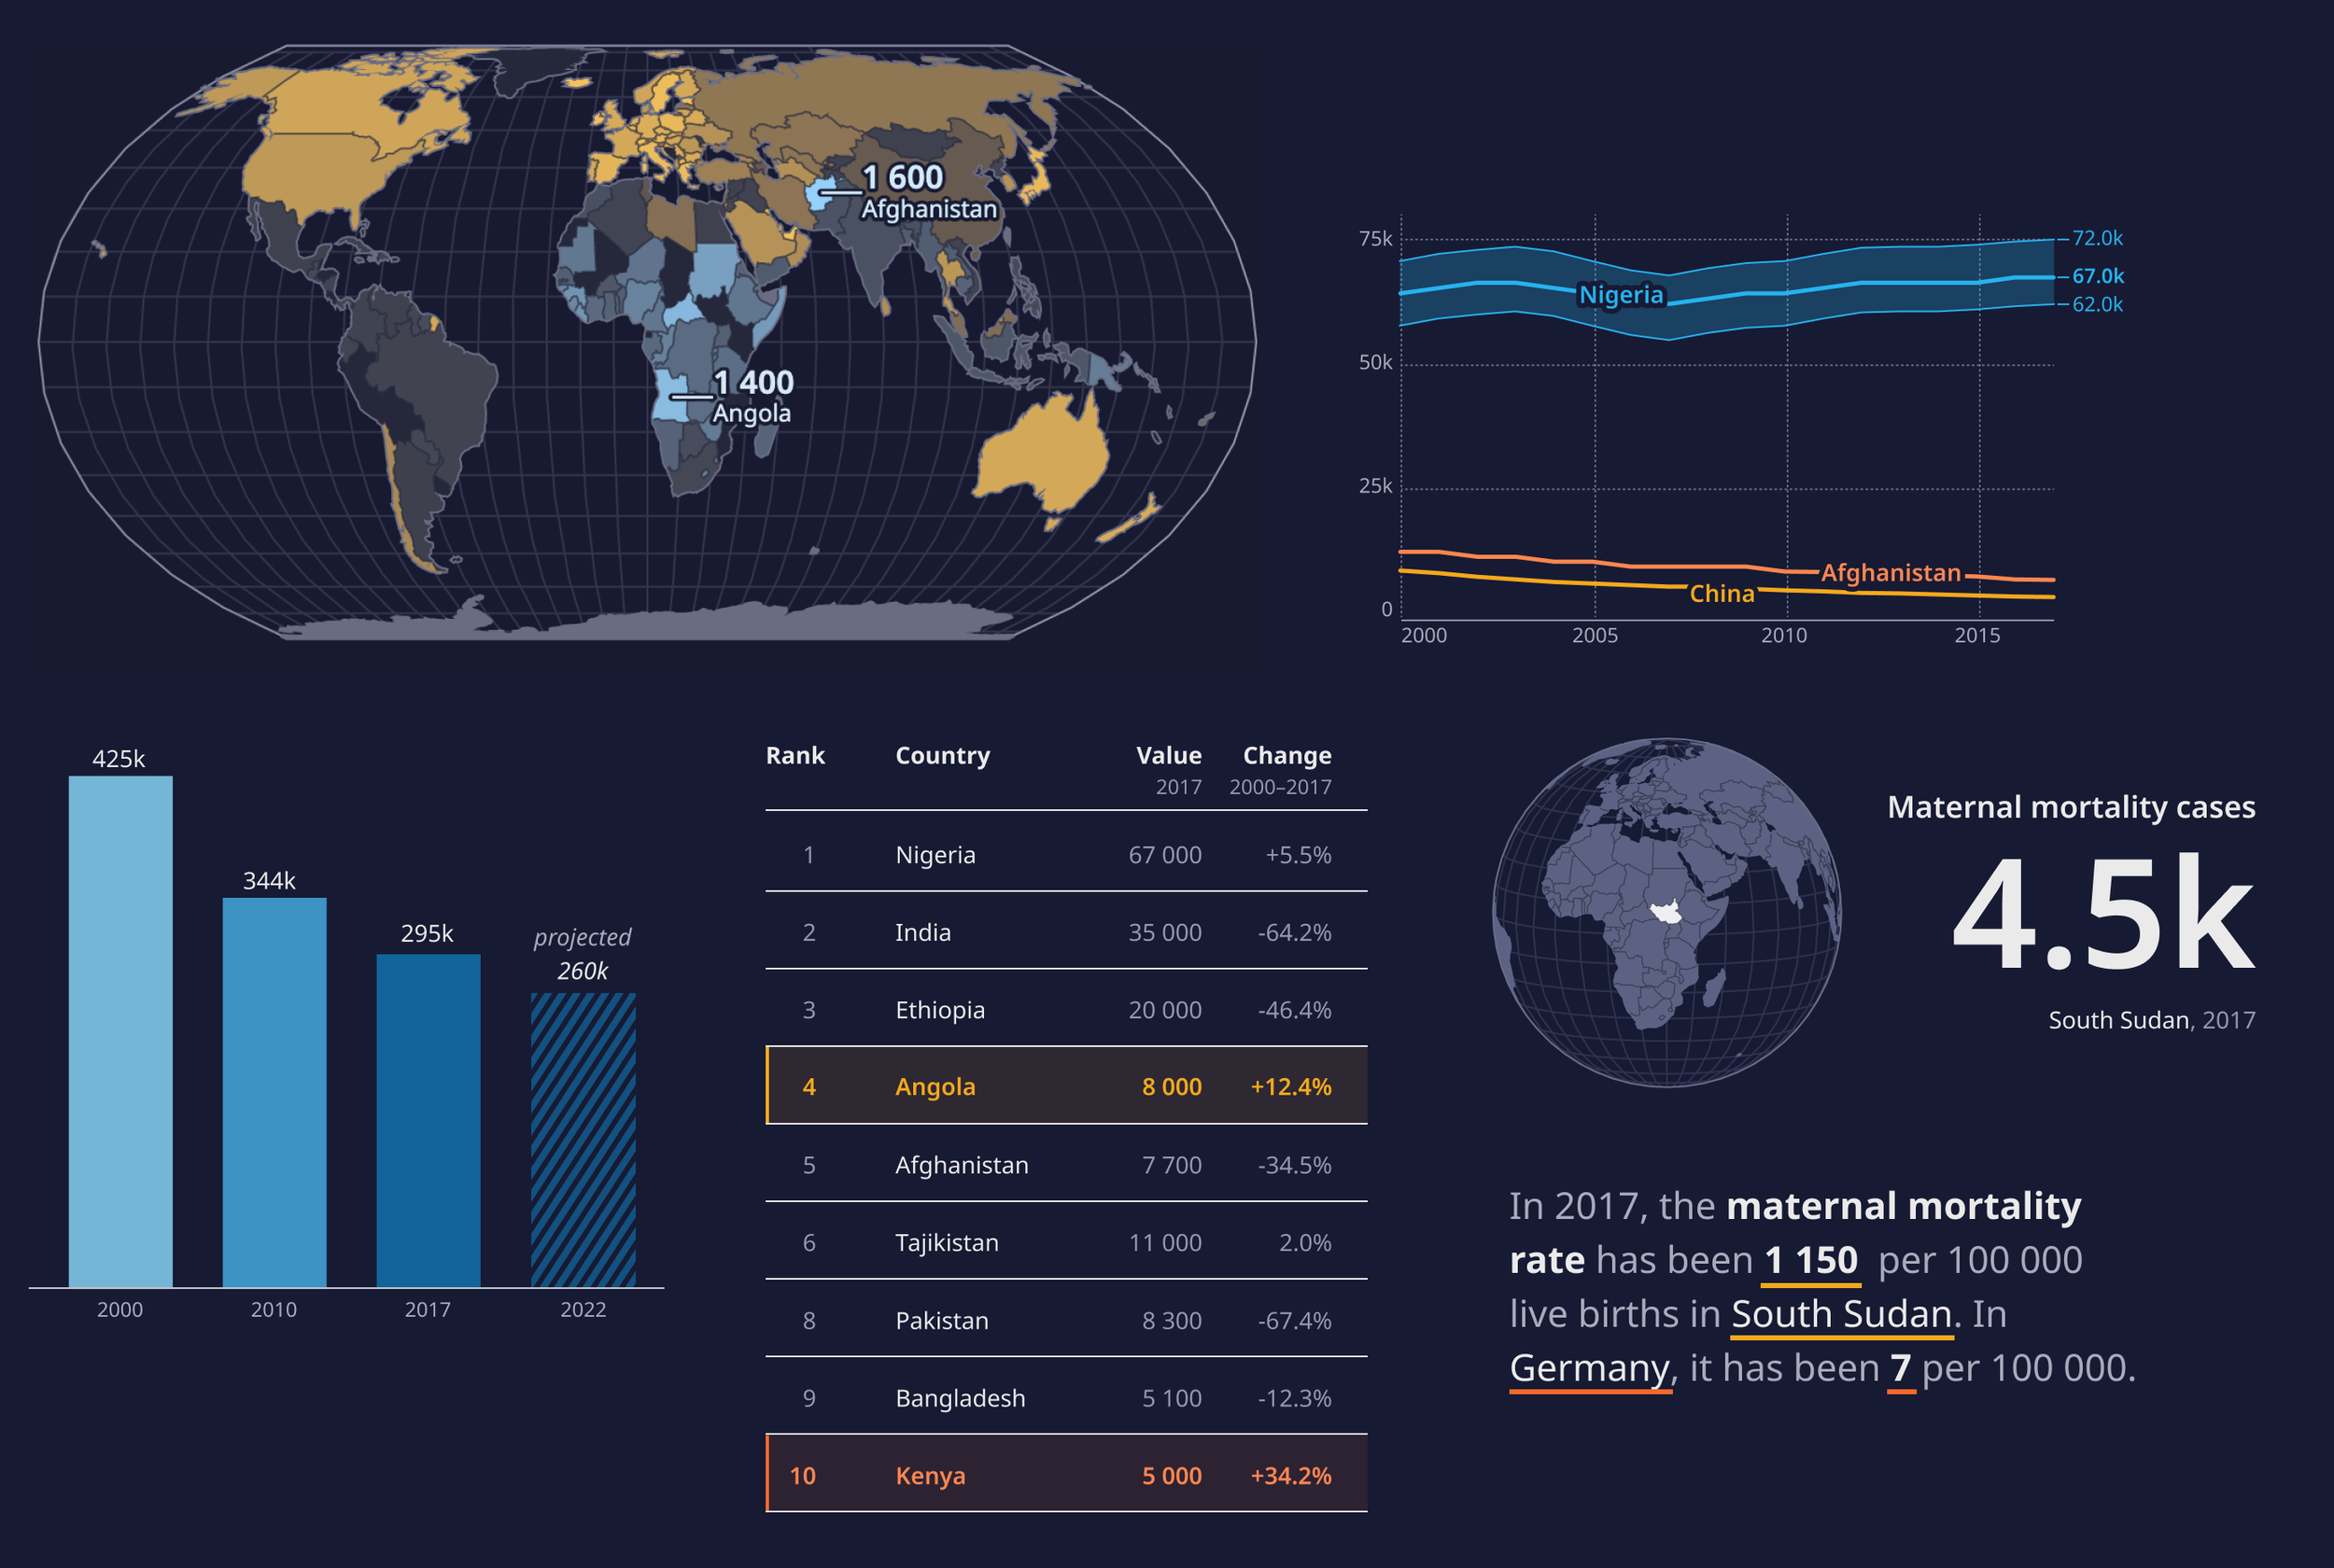
girl's education in pakistan.
Visualization & UI Design for a page that turns the World Bank’s report on Pakistan’s main barriers to girls’ education into an engaging, interactive data story for the web.
-
WHO data design language.
Supporting Kore and Truth & Beauty in shaping a recognisable data design language for the World Health Organization, designed to communicate global health data in a clear, transparent, open, and robust way.
-

suchströme.
Art Direction for a page that visualizes Search Interest in the German Election Year 2021 for the Google News Lab.
-

london's brightest businesses
Designing an appealing and playful data display of the distribution of small businesses around London’s boroughs, for workspace with infogr8.
personal & research projects.
-

titledrops.
Visualisation & Web Design for a self-initiated project that visualises the popular phenomenon of “title drops” in movies.
-
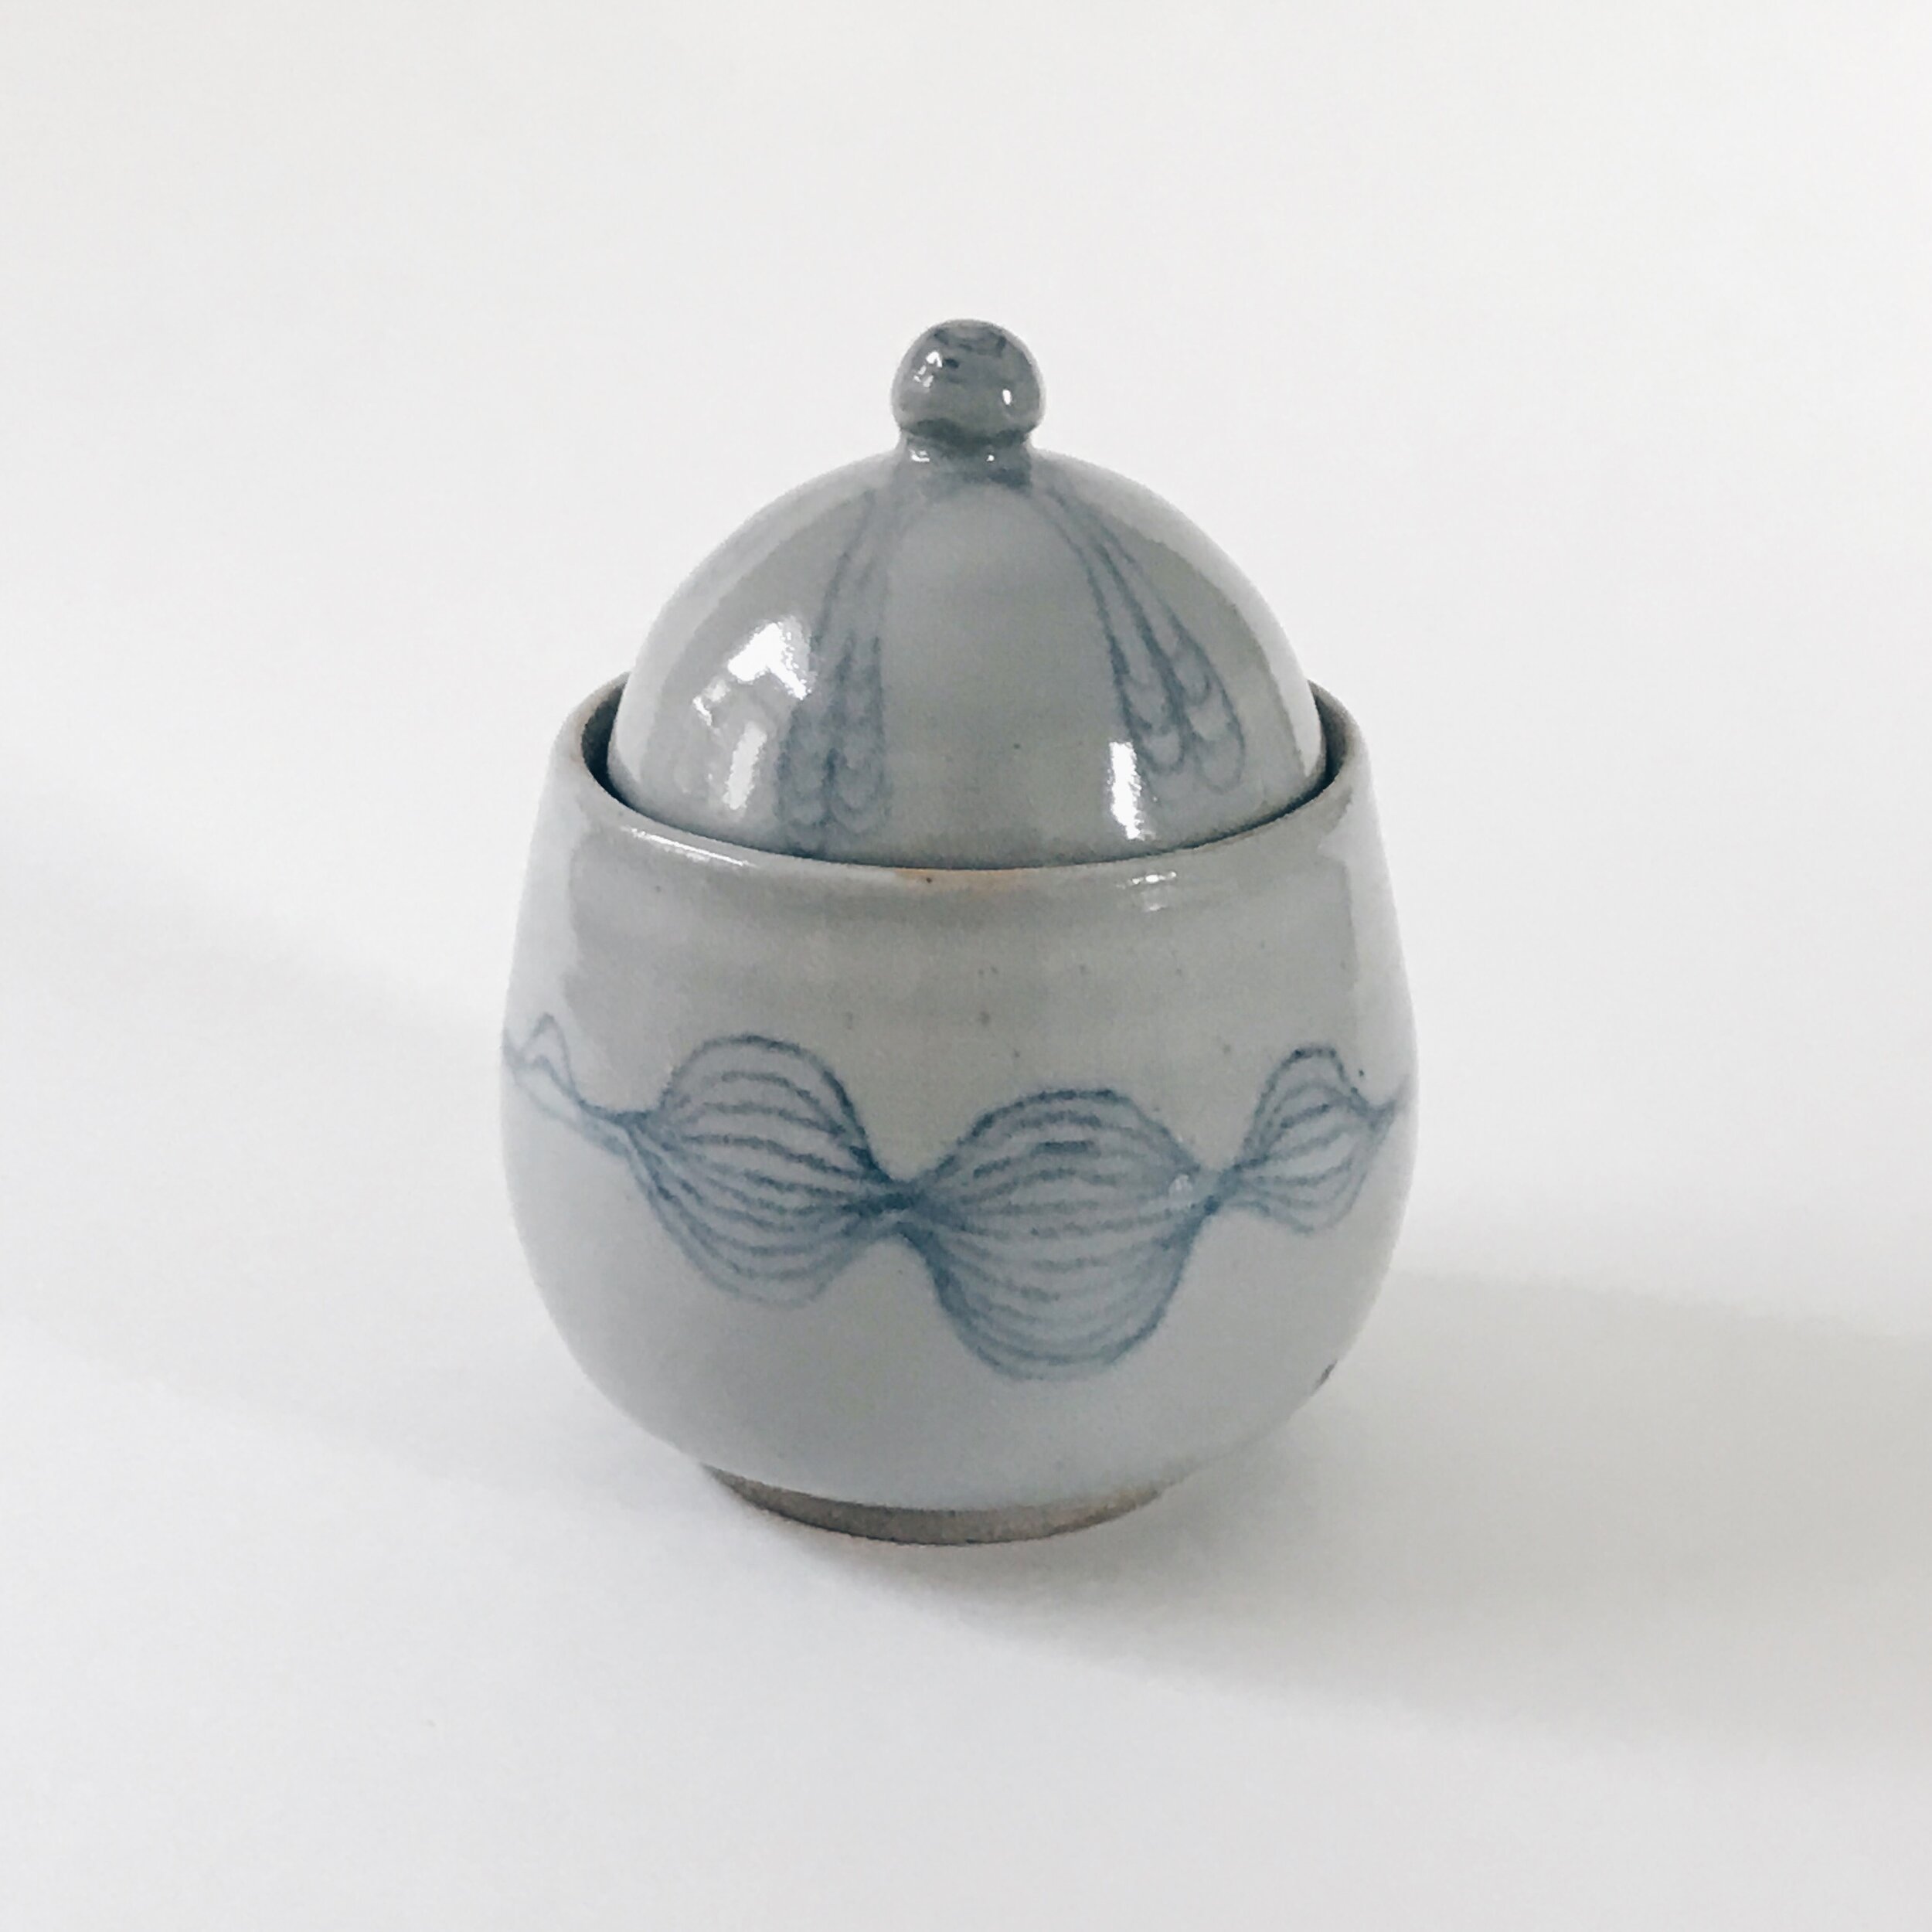
life in clay.
Turning data about my life and the lives of my loved ones into functional pottery.
-
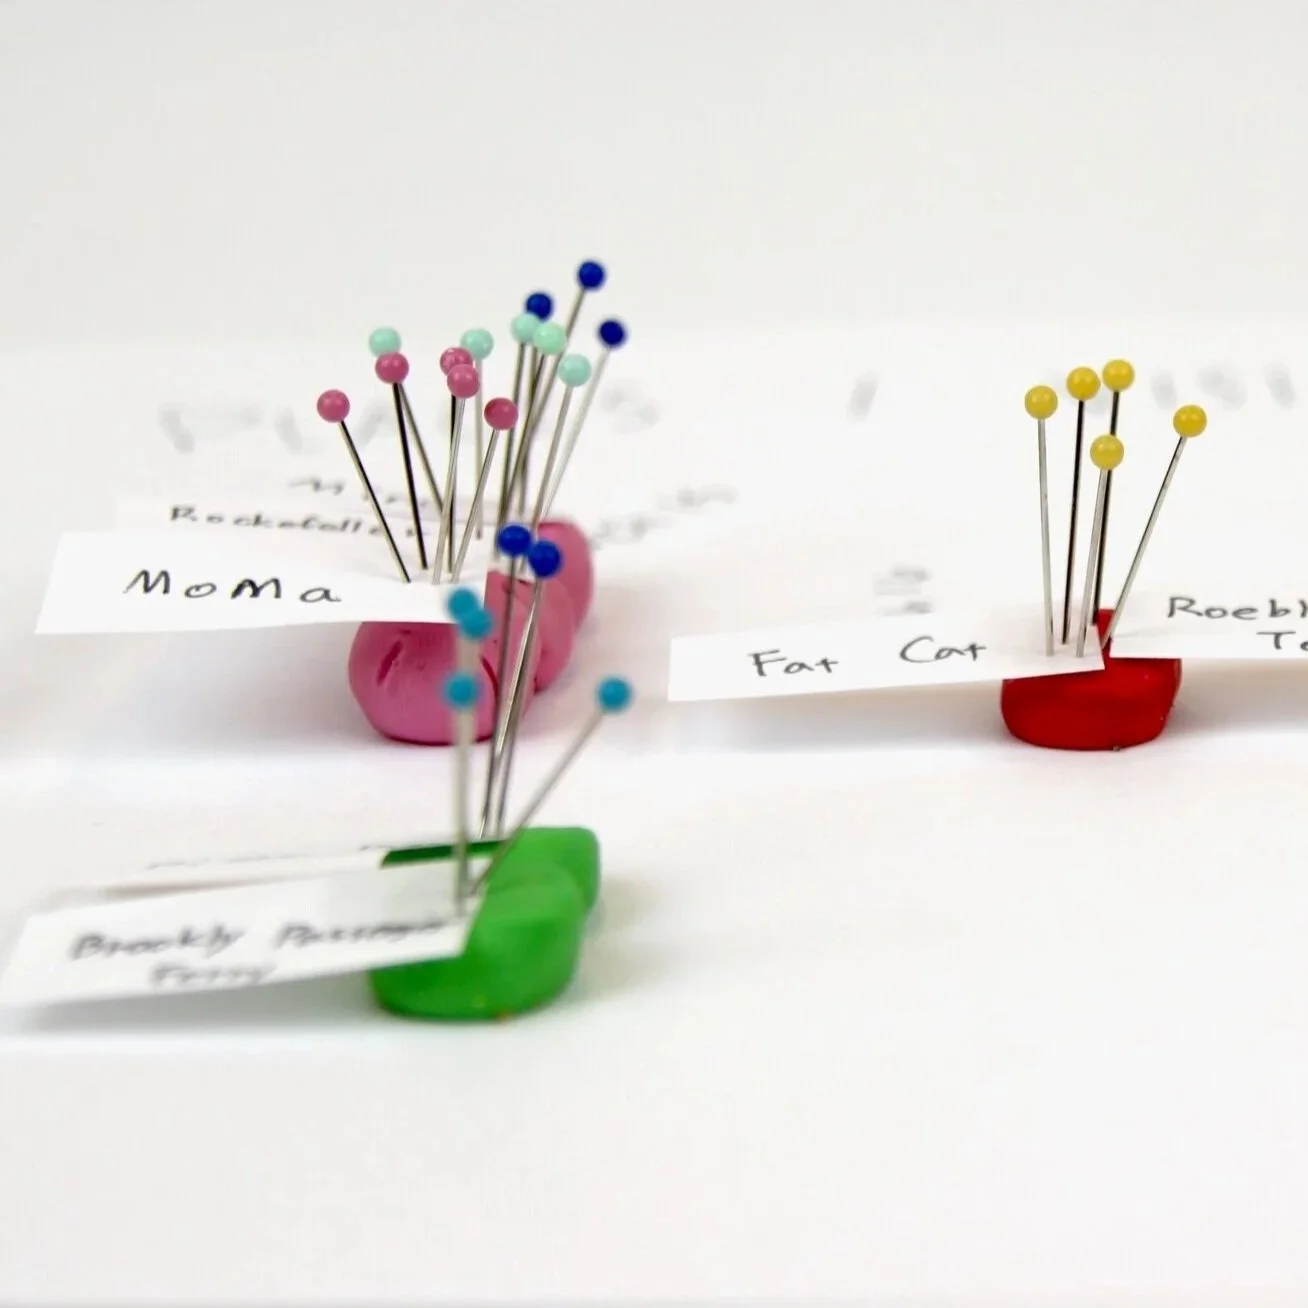
physicalization toolkit.
A kit that can be used to craft visualisations using only simple physical materials to support deep self-reflection.
-
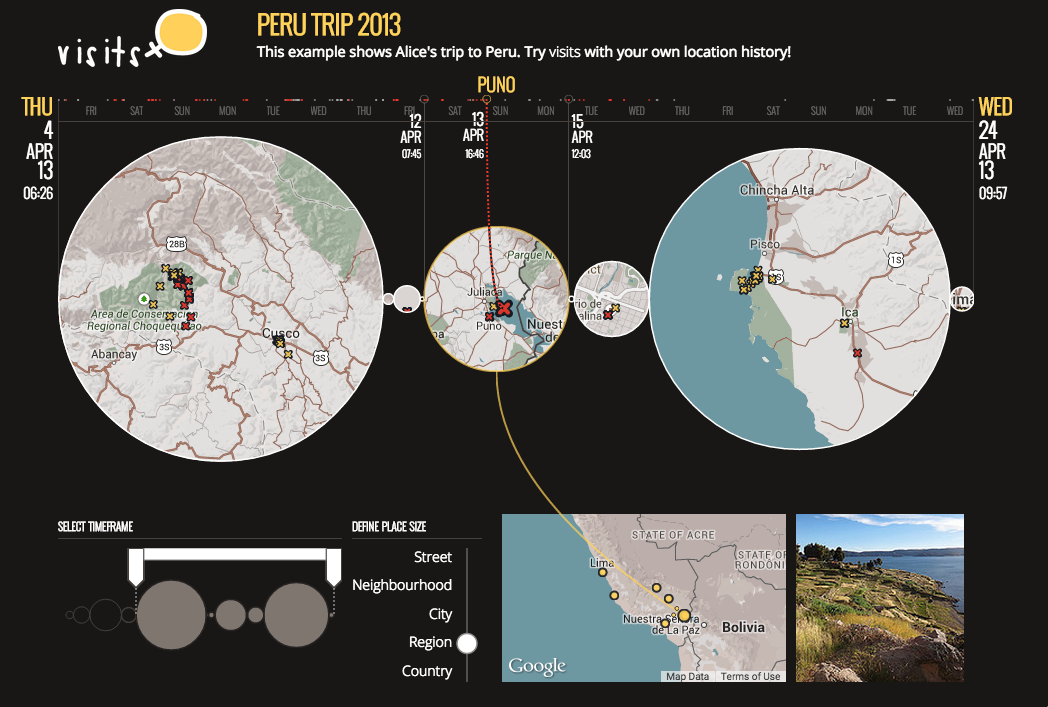
visual mementos.
Turning geolocation histories collected during travel into a visual artifact that can be used for reminiscing and social sharing.